Pentucket to Ivy League: What are your chances of getting into a top school?
The future is always burning in the back of every high school student’s mind. College is the main priority for most of these high school students. They take specific classes and enroll in athletics and extracurricular activities to better their chances of being accepted into a good school. However, as a student at Pentucket, how good are your chances of getting into a competitive college?
It has been shown through numerous studies that college acceptance and college graduation rates are higher for private school graduates, but does the matter of public schools and private schools really affect acceptance rates?
Center for Public Education published an article in April 2014 defending that public school acceptance at Ivy League schools is realistic. “Public school grads make up 55% of incoming freshman at Dartmouth and Yale, 58.7% at Princeton and 66% at Cornell University.”
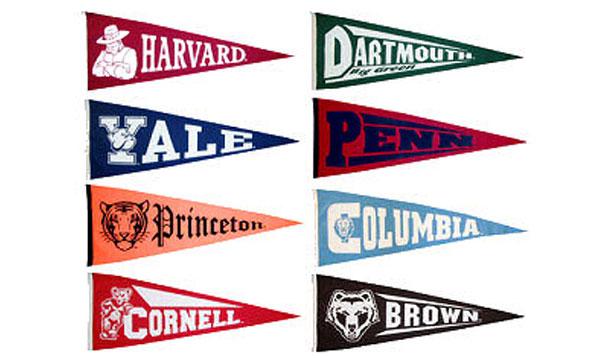
Researchers claim that this stereotype isn’t always true, and they say that any student with impressive test scores and a high GPA has a chance (although extracurricular activities and volunteer work play a huge part, too). An article by the University Language Services from May 2013 gave the average SAT scores for a portion of students accepted by Ivy League schools. Combined with the research found about high school students’ GPA standards on the Ivy League level, below is a graph displaying average acceptance statistics for Ivy League schools.
Ivy League Statistics
| School | Top 10% of High School Class | SAT Score Average (2400 scale) |
| Brown | 93% | 1980-2310 |
| Columbia | 97% | 2100-2360 |
| Cornell | 89% | 1310-1520 (disregard writing portion) |
| Dartmouth | 90% | 2030-2350 |
| Harvard | 95% | 2120-2390 |
| Princeton | 99% | 2120-2390 |
| University of Pennsylvania | 94% | 2030-2310 |
| Yale | 97% | 2110-2380 |
Researchers claim it’s possible, but do Pentucket students have faith? Senior Abbie Thurlow says, “I think it’s possible, just not for the majority.” The table below lists the 20 best National Universities of 2015 selected by U.S. News and World Report. The data was gathered from Naviance and shows the number of Pentucket applicants and their acceptance rates from 2011-2014.
Pentucket Acceptance Rates for Top 20 Schools in the Nation (2011-2014)
| School | Applied | Accepted | Waitlisted | Denied |
| Princeton | 1 | 0 | 0 | 1 |
| Harvard | 7 | 0 | 1 | 6 |
| Yale | 3 | 0 | 0 | 3 |
| Columbia | 3 | 0 | 0 | 3 |
| Stanford | 2 | 0 | 1 | 1 |
| University of Chicago | 2 | 0 | 2 | 0 |
| Massachusetts Institute of Technology | 4 | 0 | 0 | 4 |
| Duke | 6 | 1 | 1 | 4 |
| University of Pennsylvania | 3 | 0 | 1 | 2 |
| California Institute of Technology | 0 | 0 | 0 | 0 |
| Dartmouth College | 7 | 0 | 1 | 0 |
| Johns Hopkins | 3 | 0 | 2 | 1 |
| Northwestern University | 0 | 0 | 0 | 0 |
| Washington University in St. Louis | 1 | 0 | 0 | 1 |
| Cornell | 12 | 1 | 3 | 8 |
| Brown | 5 | 1 | 0 | 4 |
| Notre Dame | 2 | 0 | 0 | 2 |
| Vanderbilt | 6 | 1 | 2 | 3 |
| Rice University | 0 | 0 | 0 | 0 |
| University of California Berkely | 1 | 0 | 0 | 1 |
The data shows that acceptances are sparse, but not completely impossible. Ryan Hileman, a Pentucket senior, was accepted into Princeton this year. Ana Moura-Cook, also a Pentucket senior, was accepted into Cornell this year. Moura-Cook says, “You should be realistic, but you have to reach as well. Someone has to go to those top schools.”


